[click on the image for a larger version]
[page 129]
ANNEX D
CHRONOLOGY OF THE SWING: ENGLAND AND WALES
1. This Annex brings together the several strands of evidence on the movement away from science to show their relationship in time and the effects of demographic factors and to throw light on when the movement began.
2. The effects of the peak in the birth rate in 1947 (Figure 2) can be seen in all the data on pupils and examinations, either as a maximum or an inflexion in the curve of growth. In Figures 10 and 11 data are summarised for boys and girls separately. Data for boys show the expected sequence (Figure 10). A maximum in 1963-64 in the potential population for the first year sixth form (line C) is seen in the O level examination in the preceding academic year (lines A, B and D); a year later (1964-65) it appears in the science group of the second year sixth form (line J) and in A level attempts and passes in science (line F). Total A level passes show a change in gradient at this point (line E), the maximum being eliminated by the growth of non-science subjects. The available data for science specialists among school leavers (line K) and for university intake (line L) as yet show only the rising portion of the demographic pattern. Data for girls (Figure 11) show a similar sequence except that the numbers of science attempts and passes at O level (lines B and D) continued to rise until 1964-65, later than the peak for boys. This could indicate that these subjects were spreading more rapidly among girls in this period, and would be consistent with the lower base from which growth was occurring (science accounts for only about one quarter of all O level passes by girls) and with the generally more modest movement away from science among girls. The logarithmic presentation of data in Figures 10 and 11 emphasises the much greater loss of girls to science at each stage, en route to higher education, compared with boys (cf. paragraphs 40-41 of the Report).
3. The effects of the swing are superimposed on the demographic features. Figure 12 summarises the data in percentage terms. Among boys the declining position of science is seen in the downward trends of the last six or seven years. Statistics for individuals are not available before 1960-61 but the A level examination data suggest the swing was first apparent in this year. Up to this time there were no indications of the movement at O level, science passes (line F) (and mathematics passes alone) continuing to rise as proportions of total O level passes, to 1962-63 for boys and to 1964-65 for girls (cf. paragraphs 46-49 of the Report).
4. The pattern for girls is similar; a primarily sixth form movement without precedent at O level. In all its manifestations the swing is numerically smaller than for boys though from a smaller base figure. Percentage movements are also generally smaller, an extreme example being the proportion of science specialists among school leavers with two or more A levels, which declined by 1½ percentage points for girls (25.3 to 23.8) against almost 5½ points for boys (58.4 to 53.0) in the five year period (line B).
5. The recent decline in science and mathematics at O level both among girls and boys is a new phenomenon, quite distinct in time from the earlier movement in the sixth form. It is too recent to be confirmed as a trend, and its consequences, if any, will not be seen for some years. As discussed above (paragraph 49 of the Report) the movement may be partly related to switching of pupils from G.C.E. to C.S.E. examinations.
[page 130]
Key to Figure 10
A All O level passes.
B O level science attempts.
C Population relevant to first year sixth form.
D O level science passes.
E All A level passes.
F All A level science passes.
G Pupils in first year sixth form on A level courses.
H Pupils in second year sixth form on A level courses.
I Pupils in first year sixth form in the Science Group.
J Pupils in second year sixth form in the Science Group.
K school leavers: science specialists with two or more A levels.
L Entrants to science and technology faculties of universities in Great Britain.
Notes
1. The numbers of attempts and passes for examinations exceed those of pupils since most pupils take several subjects.
2. All data are for England and Wales only except those on university entry.
[page 131]
BOYS: SUMMARY OF DATA
 FIGURE 10
[page 132]
Key to Figure 11
A All O level passes.
B O level science attempts.
C Population relevant to first year sixth form.
D O level science passes.
E All A level passes.
F All A level science passes.
G Pupils in first year sixth form on A level courses.
H Pupils in second year sixth form on A level courses.
I Pupils in first year sixth form in the Science Group.
J Pupils in second year sixth form in the Science Group.
K School leavers: science specialists with two or more A levels.
L Entrants to science and technology faculties of universities in Great Britain.
Notes
1. The numbers of attempts and passes for examinations exceed those of pupils since most pupils take several subjects.
2. All data are for England and Wales only except those on university entry.
[page 133]
GIRLS: SUMMARY OF DATA
 FIGURE 11
[page 134]
Key to Figure 12
A A level science passes as a percentage of all A level passes.
B School leavers, science specialists with two or more A level passes as a percentage of all leavers with two or more passes.
C Pupils in the Science Group in the second year sixth form as a proportion of all pupils on A level courses in the second year.
D Pupils in the Science Group in the first year sixth form as a proportion of all pupils on A level courses in the first year.
E Entrants to science and technology faculties of universities in Great Britain as a percentage of all entrants.
F O level science passes as a percentage of all O level passes.
Notes
1. The numbers of examination attempts and passes exceed those of pupils since most pupils take several subjects.
2. All data relate to England and Wales only except for those on entry to university.
[page 135]
SUMMARY OF DATA ON THE SWING
 FIGURE 12
[page 136]
ANNEX E
EVIDENCE ON ACADEMIC QUALITY
(i) Academic Quality of School Leavers in England and Wales with A level passes
1. The growth of the sixth form and the movement away from science raise questions about the accompanying trends in academic quality. Applying the only available criterion, that of A level performance, it would appear that the growth of the sixth form has not resulted in a dilution of academic quality among school leavers holding A level passes; and that, while the science stream has lost ground to other streams at all levels of A level achievement, within the Science Group the quality of pupils is undiminished. The grounds for using this criterion set out below. Briefly,
(i) Pupils with higher numbers of passes tend to get higher grades of pass (paragraphs 5-6):
(ii) Most pupils entering university with G.C.E. qualifications obtain three or more passes: for example 85 per cent of school-leavers entering university in 1966 had three or more A levels. There has been shown to be a close correlation between the quality of A level grade combinations (1) and the proportion of applicants with a given combination accepted for university entrance (paragraph 7):
(iii) There is a direct relationship between A level performance and subsequent degree performance: an appreciably higher proportion of those with top-class A level performance, for instance, obtain first class honours degrees than of those with lower A level grade combinations: this is true of all fields of study and particularly true of science and of technology; it is likewise true of both men and women (paragraph 8).
The limitations of the criterion of A level performance were noted in the Interim Report and there are the difficulties of comparing performances in different subjects. But the evidence would suggest that among subjects held by pupils entering university this measure may usefully be applied. The great majority of subjects taken by pupils with three or more passes fall into this group.
2. Applying this measure, it may be seen from Table 50 that over the period 1960-61 to 1965-66 there is no valid statistical evidence of a dilution in quality as shown by the proportions obtaining 0, 1, 2, or 3 or more passes.
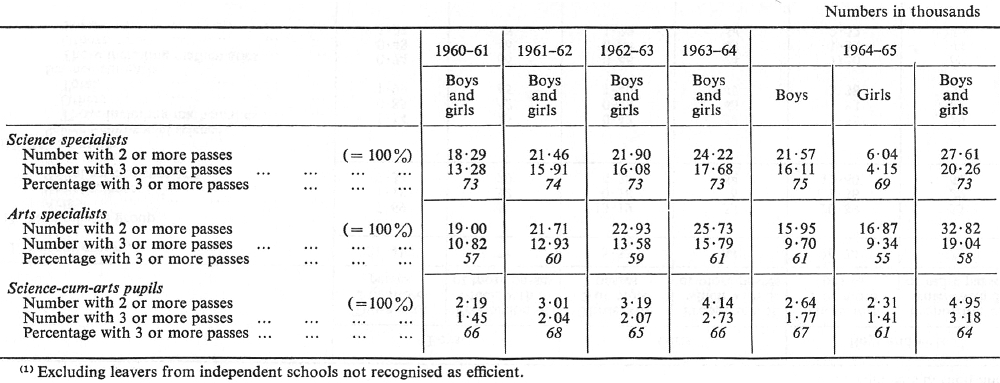
3. Of those formally qualified for university entrance (two or more A level passes) a higher proportion of science specialists obtain three or more passes compared with arts specialists or the science-cum-arts pupils and this proportion has shown no downward trend in the period of the swing (Table 51). In this respect the quality of the science group exceeds that of other groups and this quality has been maintained in recent years.
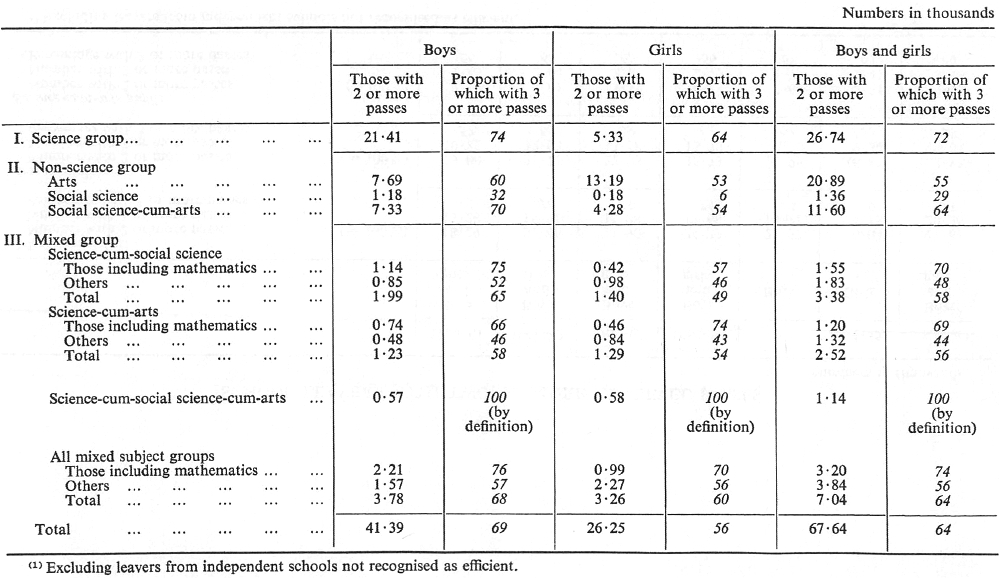
4. The time series of Table 51 cannot be extended to include the School Leavers data for 1965-66 because of the change of classification that took place (cf. Annex B). A separate analysis of these data (Table 52) shows that the Science Group with two or more A level passes again contained the highest proportion of leavers with three or more passes (72 per cent) compared with the leavers with passes in the Non-science Group, or in the Mixed Group overall. The more detailed analysis possible for this year also reveals marked differences for those with passes in the
(1) Grade combinations of A level passes are defined as combinations of the best grades obtained in each of three subjects at A level. A grade of A, B, C, D or E may be awarded in each subject and the quality of A level grade-combination may accordingly range from AAA to EEE, for those with three A level passes; from AA to EE for those with two A level passes. If scores ranging from 5 for A to 1 for E are ascribed, a given grade-combination may be regarded as equivalent in quality to one or more others e.g, CCC, BCD. ACE may in this sense be regarded as equivalent. Grades may be grouped into classes as shown in Table 56.
[page 137]
Mixed Group depending on whether or not mathematics was one of the passes. In all cases where mixed subject passes included mathematics a higher proportion of pupils obtained three or more passes, the proportions often exceeding those for the Science Group. For example 70 per cent of girls with two or more passes, including mathematics, in the Mixed Group held three or more passes compared with 64 per cent of those with two or more passes in the Science Group.
(ii) A level Passes and Grades
5. One of the major examining boards, the Northern Universities Joint Matriculation Board, provided the Enquiry with substantial details of the achievements of the candidates entering for their A level examinations in the years 1963 to 1966. From these data it is possible to compare the grades achieved by candidates obtaining two passes with those of candidates passing three or more subjects (Table 53).
6. The coverage is not complete, for instance students with a combination of passes from more than one subject group are not included in the analysis. Nevertheless the pattern that emerges is very definite; candidates with three or more passes obtain better average grades than do those obtaining passes in two subjects. For those candidates obtaining three or more passes there was no difference in the spread of the average grades between subject groups, but those obtaining two passes in arts or in the social sciences obtained rather better grades than those with two passes in science subjects. The statistics for the last four years (Tables 54 and 55) show that there has been relatively little change in the spread of average grades obtained by candidates in these years.
(iii) A Level Performance and University Entry
7. The Statistical Supplement to the Fourth Report of the Universities Central Council on Admissions gave evidence relating the A level performance of candidates for university entry to the proportion accepted in October 1966. Table 56 below gives a more detailed analysis for candidates entering university in October 1966, by the subject indicated as their first preference. The subjects covered in this Table are physics, chemistry, biology and mathematics (which amounted to about 57 per cent of the science entry), civil, electrical, mechanical and chemical engineering (about 50 per cent of the engineering and technology entry); English, French, and history (about 46 per cent of the arts entry); and economics, geography, law and sociology (about 58 per cent of the social science entry). To the extent that many candidates with higher A level grade combinations in fact return to school (possibly with entry to Oxford or Cambridge in mind) the percentages shown in Table 56 inadequately represent the full degree of correlation between A level achievement and entry to university. On this simplified basis the Table shows these main points:
(i) In all subject groups the proportion of acceptances tends to decline as the quality of A level grade combination decreases;
(ii) The decline in the proportion accepted was more marked in arts and social sciences than in science, engineering and technology;
(iii) Taking all subjects together there was a close correlation between A level grade combination and the proportion of acceptances.
(iv) A level Performance and Class of Degree
8. The Universities Central Council on Admissions has also analysed the degree results of a sample of students entering university in October 1963 and compared them with A level performance. The analysis, published in the Statistical Supplement to the Fourth Report, shows that those with higher grades of A level pass usually obtain better results in final degree examinations and that this was true for all faculties covered. For example, in science 39 per cent of candidates with three A level passes in U.C.C.A. classes 1.3 and 2.3, gained first or upper second class degrees compared with 23 per cent for classes 3.3 and 4.3. In technology the corresponding proportions were 49 per cent and 23 per cent (Table 57).
[page 138]
TABLE 50
NUMBER OF PASSES OBTAINED BY SCHOOL LEAVERS WHO ATTEMPTED G.C.E. A LEVEL (1)
 [click on the image for a larger version]
[page 139]
TABLE 51
SCHOOL LEAVERS WITH TWO OR MORE A LEVEL PASSES (1)
 [click on the image for a larger version]
[page 140]
TABLE 52
SCHOOL LEAVERS IN 1965-66 WITH THREE OR MORE A LEVEL PASSES, EXPRESSED AS A PROPORTION OF TOTAL WITH TWO OR MORE (1)
 [click on the image for a larger version]
[page 141]
TABLE 53
AVERAGE GRADE ACHIEVED BY CANDIDATES (1) OBTAINING TWO OR THREE A LEVEL PASSES IN THE JOINT MATRICULATION BOARD EXAMINATIONS (2)
 [click on the image for a larger version]
[page 142]
TABLE 54
STUDENTS WITH THREE A LEVEL PASSES IN JOINT MATRICULATION BOARD EXAMINATIONS (1)
 [click on the image for a larger version]
[page 143]
TABLE 55
STUDENTS WITH TWO A LEVEL PASSES IN JOINT MATRICULATION BOARD EXAMINATIONS (1)
 [click on the image for a larger version]
[page 144]
TABLE 56
CANDIDATES FOR UNIVERSITY ENTRY IN OCTOBER 1966 BY SUBJECT OF FIRST PREFERENCE AND BY A LEVEL GRADES
ENGLAND AND WALES
 [click on the image for a larger version]
[page 145]
 [click on the image for a larger version]
[page 146]
TABLE 57
CANDIDATES ENTERING A UNIVERSITY IN 1963 BY A LEVEL ACHIEVEMENT AT ENTRY AND CLASS OF DEGREE AT GRADUATION 1966

[page 147]
ANNEX F
STATISTICAL EVIDENCE ON THE TEACHING ENVIRONMENT IN ENGLAND AND WALES
This Annex sets out the statistical basis for Chapter III on the teaching environment. The data are taken from the results of the Curriculum Survey; the results of the Survey will be published subsequently.
[page 148]
TABLE 58
LEVEL OF QUALIFICATIONS OF TEACHERS IN VARIOUS TYPES OF SECONDARY SCHOOL, NOVEMBER 1965
 [click on the image for a larger version]
[page 149]
TABLE 59
LEVEL OF QUALIFICATIONS OF TEACHERS WITH CERTAIN SUBJECTS OF QUALIFICATION (1), NOVEMBER 1965
All secondary schools
 [click on the image for a larger version]
[page 150]
TABLE 60
AGE DISTRIBUTION OF FULL-TIME TEACHERS IN VARIOUS TYPES OF SECONDARY SCHOOL, NOVEMBER 1965
 [click on the image for a larger version]
[page 151]
TABLE 61
AGE DISTRIBUTION OF FULL-TIME TEACHERS WITH CERTAIN SUBJECTS OF QUALIFICATION,(1) NOVEMBER 1965
All secondary schools
 [click on the image for a larger version]
[page 152]
TABLE 62
AGE DISTRIBUTION OF FULL-TIME TEACHERS IN CERTAIN SUBJECT GROUPS (1) BY CLASS OF DEGREES, NOVEMBER 1965
All secondary schools
 [click on the image for a larger version]
[page 153]
TABLE 63
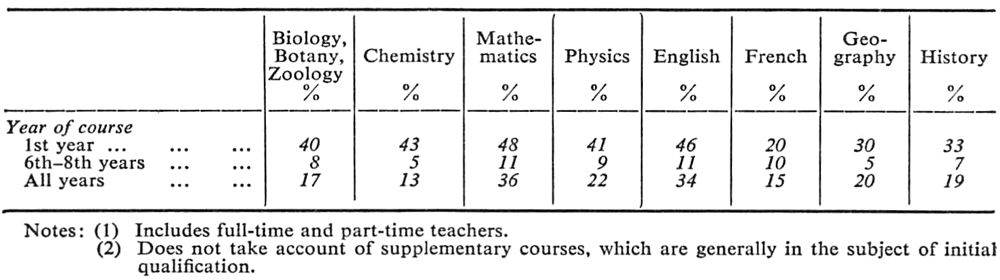
PERCENTAGE OF ALL TUITION TIME GIVEN TO TEACHING CERTAIN SUBJECTS, (1) NOVEMBER 1965
(i) ALL YEARS OF COURSE
 [click on the image for a larger version]
[page 154]
TABLE 63 - continued
PERCENTAGE OF ALL TUITION TIME GIVEN TO TEACHING CERTAIN SUBJECTS, (1) NOVEMBER 1965
(ii) FIRST TO THIRD YEARS OF COURSE
 [click on the image for a larger version]
[page 155]
TABLE 63 - continued
PERCENTAGE OF ALL TUITION TIME GIVEN TO TEACHING CERTAIN SUBJECTS, (1) NOVEMBER 1965
(iii) FOURTH AND FIFTH YEARS OF COURSE
 [click on the image for a larger version]
[page 156]
TABLE 63 - continued
PERCENTAGE OF ALL TUITION TIME GIVEN TO TEACHING CERTAIN SUBJECTS, (1) NOVEMBER 1965
(iv) SIXTH TO EIGHTH YEARS OF COURSE
 [click on the image for a larger version]
[page 157]
TABLE 64
TUITION PROVIDED BY FULL-TIME TEACHERS IN THE SUBJECT GROUP IN WHICH THEY ARE QUALIFIED, NOVEMBER 1965
 [click on the image for a larger version]
[page 158]
TABLE 65
PERCENTAGE OF TUITION (1) PROVIDED IN CERTAIN SCIENCE SUBJECTS BY TEACHERS NOT QUALIFIED IN THE SUBJECTS, NOVEMBER 1965
ALL SECONDARY SCHOOLS
 [click on the image for a larger version]
[page 159]
ANNEX G
UNIVERSITY OF ESSEX IN ASSOCIATION WITH THE ROYAL STATISTICAL SOCIETY
PROJECT ON FACTORS INFLUENCING CHOICE OF HIGHER EDUCATION
Note on the influence of the school curriculum on the flow of pupils into higher education, particularly the universities
by
Professor G. A. Barnard, Miss M. D. McCreath and Mrs. J. Freeman
Summary
Information from the project on factors influencing choice of higher education supports the hypothesis that the pre-specialisation which commonly occurs two years before O level in practice determines the O levels and A levels a child will take, the type of higher education at which a child will aim, and, for the university applicant, the faculty to which he will apply. Preliminary results are available giving the institutions at which the pupils were aiming before the G.C.E. examinations were taken in the summer of 1967, and before they had the results of their applications to universities and colleges. The follow-up, now taking place, is needed to assess the accuracy of the predictions made from certain O level combinations. If the hypothesis is proved, the implication will be that the pools from which the major university faculties will draw their 1971-72 applicants are almost certainly fixed now, and only a radical change will cut the too-powerful connection between A level subjects as now structured and university course requirements.
(i) Scope of project
1. The project is an intensive investigation of the transition between school and higher education, the latter being interpreted in a wide sense as covering universities, colleges of education and technical and other colleges of further education. It is designed to throw light on the demand for higher education, particularly how this is shaped and influenced by certain characteristics of school organisation and family background. All types of school in England and Wales with pupils over 16 (independent, direct grant, and maintained, including secondary modern) have been covered as well as technical colleges with full-time A level students.
2. The approach is factual and the emphasis is on broad trends rather than the highly individual differences between schools or pupils. It is hoped to discover the patterns of demand for higher education from schools grouped in various ways, e.g. geographically, by type, age range, numbers in the sixth form and how long it has been established, proportion going on to higher education, range of courses offered, time of specialisation, staffing, arrangements for advising on careers and higher education.
3. Besides information from the schools and colleges as outlined above, there are the data from fifth and sixth-formers and full-time A level students comprising their educational history in terms of G.C.E., their career aims and their applications to higher education institutions.
4. The material which was collected in the spring of 1967 gives the aims of some 11,000 sixth-formers and 9,000 fifth-formers in 124 schools, and 2,000 A level students in 22 technical colleges. Since then the G.C.E. examinations and results of applications to universities and colleges have intervened.
[page 160]
(ii) University entry requirements and the school curriculum
5. The main hypothesis being tested at this stage is that the specialisation which commonly occurs two years before O level determines the O levels and A levels a child will take, the type of higher education at which a child will aim, and, for the university applicant, the faculty to which he will apply.
6. This hypothesis is the result of looking at university entry requirements, the organisation of the curriculum within the schools and the relation between the pupil's O and A level subjects, as well as extensive pilot work in schools. It is not incompatible with the official statistics but it cannot be tested completely until material is available from the follow-up, now taking place. The preliminary saw tabulations afford the hypothesis some support.
7. The study will expand on Chapter 29 of the Crowther Report where pre-specialisation was discussed, and on the analysis of school leavers' O level achievements in the Statistics of Education (1). The two main ways in which this will be done are through a more detailed classification of O level subjects than has yet been made, and by basing much of the analysis on the subjects the pupil has carried to O level standard before entering the sixth and starting A level work.
8. The aim is to map out certain features of the structure of the secondary education system so as to point with greater clarity to the effect of this structure on the pupils passing through it. The present Note has been prepared with the idea of throwing light on the way the system appears to be operating, particularly as it affects university applications for science and social studies.
9. It is suspected that the effect of the system on those passing through is to enforce a general pattern which is, to a large extent, predetermined by the group of subjects included in their curriculum at age about thirteen. The hypothesis will test to what extent this is indeed the case amongst all pupils in the schools (2).
(iii) Planning the school curriculum to meet university entry requirements
10. The majority of schools where both O and A level examinations are taken send pupils to university and those which do not will sooner or later find they have young people wishing to apply. The schools are anxious to help them towards this goal, and indeed have always regarded it as a major part of their work to encourage and prepare their pupils for university entrance. But only some of the upper sixth (which is unlikely to have more than 50 pupils except in very large schools) will be applying to university and the needs of the other children have to be considered. Since the university entry requirements are the most stringent in higher education, however, they exert the strongest influence on school organisation and so the argument in this Note centres on their effect on the curriculum.
11. Because the numbers applying to university from any school each year are rarely very large, the schools tend to see the universities as a single body (which is not how the universities regard themselves) and university entry requirements for the various faculties are regarded as having a degree of coherence both with regard to the standard to be attained and the area of knowledge to be covered. It is on the basis of this resultant picture of university entry requirements that schools organise their curriculum, especially during a period of competition for university places. They must plan so as to give their pupils the maximum opportunity
(1) Statistics of Education, Part Three 1965 (Table 17) published by the Department of Education and Science.
(2) There is an equally important but complementary approach to the study of the transition between school, and higher education and career. This studies individual children and, as they progress through the education system, notes the effect of personality and motivation as well as detailed differences in the schools they attend and in the entry requirements of universities.
[page 161]
to qualify for a university place, and in this context the critical considerations are those for the capable but not exceptionally able pupil, who may not yet have made up his mind on either career or higher education course.
12. There is no faculty which at some university does not have a three A level entry requirement; some prescribe what these A levels should be. Schools planning a curriculum must take this into account or accept that their pupils will be qualified to compete for only a limited number of the available university places in a faculty. They also realise that some A level attempts will be unsuccessful. The fact that the vast majority of those taking G.C.E. who subsequently obtain university places have three or more subjects at A level (3) suggests that the schools do not limit their pupils by sixth form courses covering less than three A level subjects. Although there are university places for those with less than three A levels and for those with unusual combinations of subjects, schools cannot afford to plan a two-year sixth form curriculum on exceptions. When the time comes to fill in an U.C.C.A form these exceptions play a part in deciding for which particular course individual pupils will apply, but this does not alter the schools' primary responsibility to cater for many different pupils applying to a variety of universities. In contrast the universities' responsibility is for the individual pupils they accept from a variety of schools; those accepted for any particular course have in common a basic education because they meet certain specified requirements the university itself has laid down. How they achieve these requirements is not the direct concern of the universities; it is sufficient that those pupils who are accepted meet the conditions.
13. Two examples are given of the type of interaction which has been described. The first is from the science side, the second from the arts.
14. Schools are preparing their pupils for engineering through courses leading to three A levels since some large engineering schools ask for that number. A further reason for a three A level curriculum is that other science-based faculties, at which other members of the science sixth will be aiming, usually require three A levels. At a large engineering college, where a high proportion of the applicants put the college as first choice on their U.C.C.A. form, the entry requirements for the mechanical engineering course are two A levels, but of the applicants who get in almost all have three or more. The result of the interaction between the school curriculum and the university entrance requirements in this case is that the college, without asking, gets good students with three or more A levels and still has the freedom, if it wishes, to admit an exceptionally promising person with two.
15. On the arts side those wishing to read English literature apply from the arts sixth form. Most English departments require their students to have passed the subject at A level, and some universities require or prefer three A levels. At a new university with a two A level entry requirement in unspecified subjects, and offering a broader course leading to a literature option, 85 per cent of the entry with G.C.E. qualifications had A level English literature. An entry requirement of two A levels is more common in arts than in science, yet well over half these entrants had three or more.
16. Since the schools are forced to plan sixth form courses with university entry requirements in mind and consequently cater for three A level courses, often in prescribed subject combinations, then it is time to look at how this affects the curriculum further down the school. Few subjects are started from the beginning
(3) U.C.C.A. Statistical Supplement 1964-65 Table A: 84 per cent of those with a G.C.E. qualification and known to be accepted for admission in October 1965 had three or more subjects at A level.
[page 162]
in the sixth form, a pre-requisite for most A level work being O level standard in the subject before entering the sixth. The schools must therefore ensure that by the time their pupils enter the sixth form the likely university applicants, particularly those aiming at arts or science (including engineering, medicine (4), agriculture etc.), have a sufficient O level base from which to proceed to their three A level subjects.
17. English language and mathematics are regarded as so basic a part of a child's education that no school preparing pupils for O level would design a curriculum which would preclude a child from attempting them later at O level, though some pupils, mainly girls, drop mathematics before O level. Apart from this, English language is so frequently a required O level pass for university entrance that any potential university applicant really needs it. With regard to mathematics, an O level pass is clearly a necessary requirement for almost any sixth-form science course, and increasingly it is becoming a requirement for social studies courses at university. O level mathematics is not necessary for entry to any arts faculty. On the other hand most successful applicants have it (5). As far as the remainder of the subjects is concerned, well before the O level year most pupils are channelled (6) towards the arts or the sciences in preparation for their A level subjects.
18. At what time the channelling begins depends on two things: whether a particular combination of subjects, as in the sciences, is a necessary basis for A level work and how long a school considers is necessary to prepare the pupil for the O level examination in the group of subjects. Most commonly two years is regarded as adequate, but a sizeable proportion of schools regard three, four or even five years as necessary. The main O level combinations attempted by pupils to qualify for the science sixth are drawn from mathematics and two separate sciences from biology, botany, chemistry, physics and zoology (7). Another route, offered by considerably fewer schools, is through mathematics, biology and physics-with-chemistry. Commencing a second language (or third if Latin is already being taken) marks a route to the arts sixth.
19. Because of the link between A level work and university entry requirements, this channelling applies most strongly to those aiming at arts or science-based faculties. The A level requirements for social studies are open, so that the faculty can draw applicants widely from the whole range including those qualified for arts and for science. Among those qualified for arts and for science who apply, a higher proportion can be expected from the arts side, not least because history remains firmly on that side in all schools, and geography also in some. Among the remainder of the social studies applicants there is a group which has come up through a new route developing in certain schools, particularly large boys' schools, where economics, economic history and British constitution have been introduced into the curriculum mainly at A level. Given the tradition of tailoring the curriculum to meet university entry requirements, and because of the necessity of select-
(4) A few will enter from the arts side and do a preliminary year at university or medical school.
(5) Statistics of Education. Part Three 1965. Table 17: of the successful university applicants, 97 per cent had English language: 94 per cent had mathematics: 92 per cent had both. Those without passes had probably failed rather than never attempted.
(6) None of the eight examining boards offers less than 31 O level subjects and two offer as many as 56. At A level the number offered varies from 23-41. These figures exclude all the unusual languages, some of which are offered at both O and A level. This means that selection among the subjects which will be offered for examination at O level is inevitable, and their multiplicity increases the opportunity for specialisation.
(7) A pupil who is attempting both General Science I and General Science II at O level on the Joint Matriculation Board examinations would fall into this classification.
[page 163]
ing from the range of subjects which can be taken at A level (8), it is not surprising that there is a move in some schools to establish a third route rather than exploit the freedom of the present situation.
(iv) Analysis of O level subjects to predict freedom of choice remaining for A level work and university faculty
20. The subjects which a pupil is attempting at O level are amenable to an analysis which will indicate the possibility of the pupil applying to an arts, science-based or social studies faculty of a university. The diagrams below show how certain O level subjects have been classified so that a judgement may be made from each pupil's O level attempts (9) about the possibility that he will do A level work in arts, science or social studies (10). English language and mathematics attempts at O level have been made a pre-requisite for eventual work in any university faculty.
(a) Arts subjects
21. The diagram below shows how the possibility of a pupil's entering the arts sixth can be assessed:

(8) See Footnote (6), page 162.
(9) Subjects in which pupils are by-passing the O level examination to attempt at A level are counted as equivalent to O level attempts.
(10) It is possible for a pupil to take further O level subjects in the sixth and thus extend the range of university faculties or places for which he can apply but there is scarcely time in a two year sixth-form course to obtain both O and A level passes in the same subject starting from the beginning. Latin is the O level subject most likely to be taken in the sixth for the purpose of fulfilling university entrance requirements. There are a few schools where the subject is not taught below the sixth form. A very small number of intending medical students may begin biology in the sixth for A level.
There is an opportunity, too, to retake subjects after failure but it is unlikely that a pupil will choose as A level subjects those in which he has done badly at O level. On the other hand there is the possibility of recouping English language or mathematics and this is important.
[page 164]
Where arts subjects are defined as:
English literature
History
Ancient/Greek/Roman history
Greek and Roman literature
Welsh language
Welsh literature
Greek
French
German
Italian
Russian
Spanish
Latin at O level has been made a condition of a child being well equipped for an arts A level course with a view to university entrance, because by far the greater number of universities require O level Latin and an even greater percentage of places are dependent upon it. A child really well equipped for the arts sixth has O level Latin and at least two other arts subjects. A child not so well equipped would enter the arts sixth without Latin, but with at least two arts subjects still in his timetable during his O level year.
(b) Science subjects
22. The diagram below shows how the possibility of a child's entering the science sixth can be assessed:

Where separate and combined science subjects are defined as:
| Separate sciences (7) | Combined sciences |
Biology
Botany
Zoology
Physics
Chemistry
Geology | Physics-with-chemistry
General science
Additional general science
Engineering science
Human biology/anatomy, physiology and hygiene
Agricultural/horticultural science/rural biology |
[page 165]
The overwhelming number of university science-based courses, mathematics excepted, require two science subjects at A level or one at A level and the other at O level.
(c) Social Studies subjects
23. For reasons outlined earlier in this Note, the route to social studies is not so clearly defined as those to arts and science. In those schools where the pattern is developing the following diagram assesses the possibility of eventual specialisation in the social studies field. It can also be used more tentatively for pupils from schools where there is as yet no sign of a definite route:

Where social studies subjects are defined as:
Geography
British constitution/government/law
Economics
Economic history
and arts subjects as in (a) above.
(d) O level groups for prediction
24. Once a pupil's O level attempts have been inspected in the light of each of the three diagrams, it becomes possible to place him in one of the following twelve groups:
A Arts
B Arts or science
C Arts or social studies
D Arts or science or social studies
E Science or weaker arts (11)
(11) The term 'weaker arts' is used in the sense that the child has missing an essential requirement for many arts courses at several universities, which between them have a large number of undergraduate places for arts.
[page 166]
F Social studies or weaker arts
G Science or social studies or weaker arts
H Science
I Social studies
J Science or social studies
K Weaker arts
L Neither arts nor science nor social studies
25. From these groups (12) the prediction for a pupil who falls in group A would be that he was likely to attain the necessary qualifications for an arts faculty place and was likely to do arts subjects at A level. A pupil in group D, however, could qualify for arts, science or social studies at university according to his choice of subjects for A level work. In looking at these groups the provisos noted earlier, relating to the entry requirements for social studies and medicine (paragraph 19 and footnote (4)), ought to be kept in mind.
26. One result of analysing O level attempts in this systematic way is that it enables a calculation to be made as to how many and which O levels a child should attempt if he wishes to keep as many options as possible open for A level work and so delay a career commitment. Group D has kept the options open (13) and from the diagrams it is possible to deduce an eight O level group which would allow for A level work and thus university study in some branch of each of the major areas of study. This group would consist of:
English language
Mathematics
Latin
2 arts subjects
2 science subjects
1 social studies subject
The arts subjects are to be chosen from literature, history and foreign languages (both classical and modern). Although it is possible to reduce the number of subjects to seven by dropping the social studies subject (geography, British constitution, economics or economic history) and ensuring that one of the arts subjects is history, this means cutting out two of three areas - literature or classics or modern languages - and thus imposing a severe limitation on any future choice within the arts faculty. Pupils in group B may fall in this category.
27. The only way of spanning the physical and biological sciences within the eight O level group is by taking biology and physics-with-chemistry (14). This is obviously a weaker base for A level work in the physical sciences than would be provided by physics and chemistry taken as separate subjects.
28. This list of subjects raises several rather different questions. The first is what proportion of pupils is taking the group? Another is how valuable educationally is such a group of subjects taken during the years leading to O level?
(12) The concept of O level groups has been developed independent of pupils' ability other than as measured by the number of A levels normally achieved by university applicants and the subjects which must be taken at O and A level to meet the entry requirements of those university courses which specify the greatest number of subjects. The groups to which pupils belong from any one school are partly determined by the way the curriculum is organised in that school. Schools differ in organisation but they all have pupils they judge able.
(13) To keep the choice of university course completely free until entering the sixth and starting A level work would require a number of O level subjects far beyond what could reasonably be expected of any child, however able.
(14) Almost half of the 124 schools which participated in the project did not offer this combination of subjects.
[page 167]
A third is, that, given the proportion of children taking such a group is likely to be small, are pupils at 12, 13 or 14 either old enough, well enough informed about the nature of subjects or possible careers or even sure enough of their interests to make a choice of subjects which can involve cutting themselves off from the likelihood of qualifying to work in whole major fields?
29. Preliminary raw tabulations from the surveys give some measure of what is happening.
TABLE 1
FIFTH-FORMERS TAKING EIGHT OR MORE O LEVELS (1)
 [click on the image for a larger version]
In Table 1 the pupils in group D have definitely kept the options open and so may those in group B. Groups G and E are comparable to D and B respectively but the pupils in them do not have Latin. If they choose the arts side in the sixth and aim at university, then they have two alternatives: the first is to try to get into a place where Latin is not required and the second to take O level Latin in the sixth in addition to a full A level load. To summarise the position in the fifth form, 6 per cent only of those taking eight or more O levels have definitely kept the options open and possibly 16 per cent, whilst for a further 39 per cent there is flexibility but it involves extra work in the sixth.
TABLE 2
SIXTH-FORMERS ATTEMPTING THREE OR MORE A LEVELS (1)
 [click on the image for a larger version]
30. The contrast in the O level backgrounds of those firmly committed to either the arts or science sides (i.e. taking three or more A levels exclusively on either side) is shown in Table 2. The proportion of science specialists who have
[page 168]
two or more separate sciences at O level before entering the sixth is very high. It is almost double the proportion of arts specialists who have two or more modern languages. It should be pointed out that, as an introduction to science work at A level, two separate sciences at O level are shown to be more common than one separate plus one combined science.
31. About one-quarter of the sixth-form sample had no career in mind and, of those who had, no less than one-third claimed to have decided on it when aged 17 or over, i.e. when already embarked on their A level course.
(v) Implications
32. Over the years, and particularly since G.C.E. was introduced, a delicately balanced situation has arisen between those schools preparing pupils for the universities and the universities themselves. It is suggested that this is mainly the result of the changeover from a group examination to a subject examination with a proliferation of subjects at O and A level, combined with increased pressure on university places. By insisting that university candidates should have reached A level standard before leaving school in certain specified subjects and being able to fill the majority of university places with pupils who have three or more A levels, the sixth form has been left with little minority time and, unless O level subjects are very carefully chosen, some pre-specialisation is more or less inevitable at least two years before O level. It is this pre-specialisation which has led to a limitation of choice within the whole system and this is especially marked for those channelled towards science or modern languages.
33. The present shortage of science applicants for university places may well be one product of such a type of system. The real cause would not be at university entrance, nor at entry to the sixth form but, at a minimum, two years before attempting O level. There would, therefore, be a four to five year time lag between cause and effect, leaving aside the time necessary for what appeared as a fluctuation to become established as a trend and so cause concern. The system would also enable a prediction to be made about the growth in the numbers applying for social studies because of the flexible university course requirements and an increasing desire to go to university.
34. In the present situation marginal changes by individual universities in their entry requirements will have little effect. The most desired institutions and the most desired subjects can afford to make concessions in the knowledge that the majority of their candidates will continue to have the same qualifications, though they may pick up the odd promising but unconventionally qualified person through the concession. What is needed to break the impasse is a radical change which will cut the too-powerful connection between A level subjects as now structured and university course requirements. The inertia in the system is such that the pools from which the major university faculties will draw their 1971-72 applicants are almost certainly fixed now. The raw tabulations from the national surveys of the fifth-formers and sixth-formers give no reason for complacency. Data from the follow-up, now taking place, is vital to assess the accuracy of the prediction made from the O level groupings which have been devised, and thus provide further information for the current debate on the sixth-form curriculum.
October, 1967.
[page 169]
INDEX TO TABLES
(a) Tables in the text
| page |
| 1. Number of pupils in all schools in first year of the sixth form on A level courses: actual and estimated | 9 |
| 2. Main destinations of school leavers with A level passes in 1965-66 | 16 |
| 3. School leavers in 1965-66 entering university with two or more A level passes | 17 |
| 4. School leavers in 1965 with two or more A level passes entering university | 18 |
| 5. Estimated initial home entrants to university including the former Colleges of Advanced Technology, by faculty | 19 |
| 6. School leavers with one or more G.C.E. A level passes entering colleges of education | 21 |
| 7. School leavers entering colleges of education | 22 |
| 8. Students on courses in further education other than those on G.C.E O and A level courses distinguishing those following science and technology courses: November 1965 | 24 |
| 9. Students on G.C.E A level courses in further education establishments | 25 |
| 10. Estimated number of initial home entrants to full-time advanced courses (including sandwich courses) in further education establishments | 25 |
| 11. 'Fall-off' of sixth form pupils from A level courses | 27 |
| 12. Comparison of boys and girls following science | 28 |
| 13. G.C.E. A level summer examinations | 31 |
| 14. Full-time teachers, with qualifications in particular subjects, November 1965 | 36 |
| 15. Tuition provided by full-time teachers in the field of subjects in which they are qualified, November 1965 | 39 |
| 16. Proportion of tuition in subjects from teachers without qualifications in the subjects, November 1965 | 40 |
| 17. Proportion of science teaching from teachers without qualifications in science, November 1965 | 40 |
| 18. Percentage of tuition in science and languages received from full-time graduate teachers qualified in the subject, November 1965 | 42 |
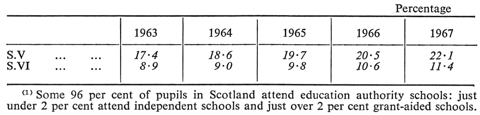
| 19. S.V and S.VI pupils as percentages of the relevant age groups (Scotland) | 47 |
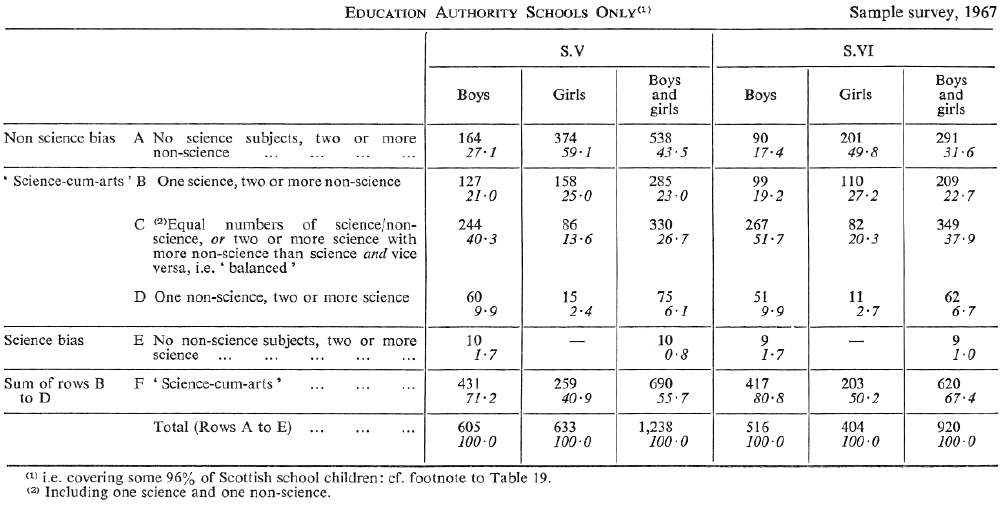
| 20. Numbers and percentages of S.V and S.VI pupils with the course structures shown - including English (Scotland) | 53 |
| 21. Numbers and percentages of S.V and S.VI pupils with the course structures shown - excluding English (Scotland) | 54 |
| 22. Percentages of total number of S.IV, S.V and S.VI pupils studying certain subjects (Scotland) | 55 |
| 23. Percentages of school leavers with three or more Higher grades who possess a Higher grade in mathematics - 1966 (Scotland) | 59 |
| 24. Percentages of qualified school leavers with an Ordinary grade but no Higher grade in mathematics - 1966 (Scotland) | 59 |
| 25. Proportions of candidates expected to sit Ordinary grade examinations on the new syllabuses in physics and chemistry (Scotland) | 59 |
| 26. Proportions of candidates expected to sit Ordinary grade examinations on the new syllabus in mathematics (Scotland) | 60 |
| 27. School leavers with two Higher grades and more (Scotland) | 62 |
| 28. Destinations of qualified leavers - 1966 (Scotland) | 63 |
| 29. Science, non-science bias of school leavers with three Higher grades and more - percentage of all school leavers falling into the category shown - 1966 (Scotland) | 64 |
| 30. School leavers entering university with 3 Higher grades or more - 1966 (Scotland) | 65 |
(b) Tables in Annex C
| 31. Estimated potential population from which entrants to the sixth form can be drawn | 107 |
| 32. Boys on A level courses in sixth forms: all schools | 108 |
| 33. Girls on A level courses in sixth forms: all schools | 109 |
| 34. Pupils on A level courses in the first year of the sixth form 1962-71; number and as percentage of total and of potential population | 110 |
| 35 A level pupils staying on for a third year in the sixth form | 111 |
| 36. G.C.E O level summer examinations: 1960 to 1966: Boys | 112 |
| 37. G.C.E. O level summer examinations: 1960 to 1966: Girls | 113 |
| 38. C.S.E. examinations, 1965 and 1966 | 114 |
| 39. Passes in G.C.E. O level and Grade 1 of C.S.E. examinations | 114 |
| 40. G.C.E A level summer examinations: 1960 to 1966: Boys | 115 |
| 41. G.C.E. A level summer examinations: 1960 to 1966: Girls | 116 |
[page 170]
| page |
| 42. School leavers with one or more A level passes 1960-61 to 1964--65: Boys | 117 |
| 43. School leavers with one or more A level passes 1960-61 to 1964-65: Girls | 118 |
| 44. School leavers with one or more A level passes 1960-61 to 1964--65: Boys and Girls | 119 |
| 45. Changes in number of school leavers with one or more G.C.E. A level pass | 120 |
| 46. School leavers with passes at A level: 1964--65 | |
| (i) Boys with one or two passes | 121 |
| (ii) Boys with three or more passes in lower grade combinations | 122 |
| (iii) Boys with three or more passes in higher grade combinations | 123 |
| 47. School leavers with passes at A level 1964--65 | |
| (i) Girls with one or two passes | 124 |
| (ii) Girls with three or more passes in lower grade combinations | 125 |
| (iii) Girls with three or more passes in higher grade combinations | 126 |
| 48. School leavers with two or more passes in the G.C.E A level examinations: 1965-66 | 127 |
| 49. School leavers in 1965-66 with two or more A level passes who planned to enter university by proposed subject of study | 128 |
(c) Tables in Annex E
| 50. Number of passes obtained by school leavers who attempted G.C.E A level | 138 |
| 51. School leavers with two or more A level passes | 139 |
| 52. School leavers in 1965-66 with three or more A level passes expressed as a proportion of total with two or more | 140 |
| 53. Average grade achieved by candidates obtaining two or three A level passes in the Joint Matriculation Board examinations | 141 |
| 54. Students with three A level passes in the Joint Matriculation Board examinations | 142 |
| 55. Students with two A level passes in the Joint Matriculation Board examinations | 143 |
| 56. Candidates for university entry in October 1966 by subject of first preference and by A level grades, England and Wales | 144 |
| 57. Candidates entering a university in 1963 by A level achievement at entry and class of degree at graduation 1966 | 146 |
(d) Tables in Annex F
| 58. Level of qualification of teachers in various types of school, November 1965 | 148 |
| 59. Level of qualification of teachers with certain subjects of qualification, November 1965 | 149 |
| 60. Age distribution of full-time teachers in various types of secondary school, November 1965 | 150 |
| 61. Age distribution of full-time teachers with certain subjects of qualification, November 1965 | 151 |
| 62. Age distribution of full-time teachers in certain subject group by class of degree, November 1965 | 152 |
| 63. Percentage of all tuition time given to teaching certain subjects, November 1965 | |
| (i) All years of course | 153 |
| (ii) First to third years of course | 154 |
| (iii) Fourth and fifth years of course | 155 |
| (iv) Sixth to eighth years of course | 156 |
| 64. Tuition provided by full-time teachers in the subject group in which they are qualified, November 1965 | 157 |
| 65. Percentage of tuition provided in certain science subjects by teachers not qualified in the subject, November 1965 | 158 |
(e) Tables in Annex G
| 1. Fifth formers taking eight or more O levels | 167 |
| 2. Sixth formers attempting three or more A levels | 167 |
[page 171]
INDEX TO FIGURES
(a) Figures in the text
| page |
| 1. Flow of pupils through schools and into higher education: England and Wales (1) | 7 |
2. Population of 18 year olds in England and Wales
Source: Statistics of Education 1966, Vol. 1, Table 43 | 10 |
3. Proportion of the age-group on first year A level courses in the sixth form
Source: Table 34 in Annex C | 11 |
| 4. Pupils in schools: | |
| A. 16 year olds | 12 |
B. 18 year olds
Source: Statistics of Education 1966, Vol. 1, Table 44 | 12 |
5. Proportion of first year sixth on each type of A level course
Source: Table 34 in Annex C | 13 |
6. Projections of numbers in the first year of the sixth form studying on A level courses
Source: Table 1 | 14 |
7. Proportion of candidates for entry to university applying and admitted to science and technology faculties
Source: Fourth Report of the Universities Central Council on Admissions | 20 |
| 8. Population of 17 year olds in Scotland | 48 |
| 9. Pupils in schools in Scotland | 49 |
(b) Figures in Annex D
| 10. Boys: Summary of data | 131 |
| 10. Girls: Summary of data | 133 |
| 12. Summary of data on the swing; boys and girls | 135 |
(1) Notes to Figure 1:
(a) Those in the first or third year of the sixth form.
(b) Of these, 35,000 school leavers, 18,000 were science specialists of whom 15,000 were entering science faculties at university.
(c) There is a movement from non-advanced courses into higher education but this is not yet fully documented.
(d) A cohort is here defined as any group of students who are potential entrants to G.C.E Ordinary level examinations in any one year.


 Dainton (1914-1997), an academic chemist, was Vice-Chancellor of the University of Nottingham at the time of this report.